
June 2, 2021
Is NeuralProphet better than Prophet for sales forecasting?

In this blog post we’ll compare two time series forecasting models for predicting sales volume in retail.
The first one is Prophet, a model that Facebook developed a couple of years ago. Last month its code package hit version 1.0 on GitHub, so it’s a relatively mature model compared to the second one, which is NeuralProphet.
As the name suggests, NeuralProphet is similar to Prophet but it throws some neural networks in the mix to spice things up. It’s also not Facebook that develops the model.
What is Prophet?
Prophet decomposes a time series into distinct components. The components are all functions of time. The most important ones are:
- Daily seasonality
- Weekly seasonality
- Yearly seasonality
- Trend
- Holidays and events
The seasonalities are Fourier series. The sinusoids in the Fourier series have periods that match the seasonality. E.g. The amount of periods per day will always be a whole number for the daily seasonality. The same goes for the amount of periods per week for the weekly seasonality.
The trend component is a piecewise linear function. The parameters for this component are the deltas between each piece of the trend.
The final component in Prophet models events and holidays. They are different from seasonalities because they have a similar effect across years, but a different timing. They are modeled with an indicator matrix that says when each event takes place and a vector that represents the impact of each event.
The beauty of an additive model like this, is that you can further extend it with new components. You could for example add an extra linear term to model the impact of an external time series. (The clever reader now wonders why we would limit ourselves to linear regressors… *Suspenseful foreshadowing of the NeuralProphet section*)
E.g. to forecast toilet paper sales, you could add an external regressor that represents the amount of times the word ‘lockdown’ is used in the news the night before. 💩
Now we only need to find the optimal parameters for the model. The Prophet code package relies on Stan and its optimisation methods to fit the model. Who knew Stan is not only your biggest fan, but also a programming language for statistical modelling!
What is NeuralProphet?
NeuralProphet is the result of extending the basic Prophet model with an extra term, which is AR-Net. We already know Prophet, so let’s look at AR-Net, a pirate’s favourite modelling technique.
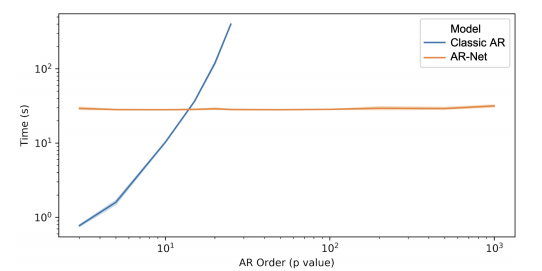
The authors of AR-Net propose to learn an autoregressive forecasting model with a feedforward neural network. Autoregressive models are nothing new, but usually you would use a linear model fit with least squares instead of neural networks fit with backpropagation.
A multi-layer feedforward neural network is obviously more expressive than a linear model, but there’s another advantage as well. AR-Net also scales much better to larger datasets and more inputs as this graph shows:
Apart from AR-Net, NeuralProphet also upgrades Prophet’s linear external regressors to feedforward neural networks because deeper == better.
Adding neural networks to Prophet has the downside that the amount of learnable parameters increases dramatically. To cope with that, NeuralProphet swaps out the Stan backend for a PyTorch one, and trains with stochastic gradient descent.
Enough talking. Let’s try out both models in the wild!
Face-off with weekly e-commerce data
At ML6, we have the luxury of coming across tons of terrific (and less terrific) client data sets. For this first experiment, we’ll use one of those data sets.
The data set is from an e-commerce company that wants to forecast the sales of their products to avoid running out of stock. In the real project, we’re forecasting 40k items on a weekly basis, but here we’ll aggregate the items per category to simplify things for the kids in the audience.
The categories of interest are all clothing types like T-shirts, hoodies, leggings, and real pants.
To summarise, this is the setup we use to evaluate the models:
- # weeks training data: 157
- # weeks test data: 9
- # categories: 16 (Parka, Hoody, Jeans, Dress, Leggings, Crewneck, Zip Hoody, Sweatpants, Sweatshirt, Light Jackets, Bomber Jackets, Shirt, Sweat Jumpsuit, College Jackets, T-Shirt, T-Shirt long sleeve)
- Evaluation metric: sMAPE, like they use in the M4 forecasting competition (Note: in M5, the well-named successor of M4, the sMAPE metric is replaced by the weighted root mean squared scaled error, but we choose sMAPE here because more people know and understand a good old sMAPE.)
The difference between the Prophet and NeuralProphet model is AR-Net. So, if we don’t add the AR-Net to NeuralProphet, we expect that Prophet and NeuralProphet will learn the same parameters and get the same performance.
But they don’t. These are the results for the out of the box models:

If the difference is positive, NeuralProphet performed better than Prophet.
In the last row, we see that Prophet performed 3.9% better than NeuralProphet on average.
Because the difference is the biggest for T-shirts, let’s see if we can find out what goes wrong with NeuralProphet’s predictions.
Prophet:

NeuralProphet:

It seems like NeuralProphet fits the training data better, but its forecast is worse. That smells like overfitting.
Like explained in the previous sections, both Prophet and NeuralProphet learn to decompose a time series. Let’s plot those components to get some more insights into the models.
Prophet:

Prophet learned a really simple trend and every year the highest T-shirt sales are in Spring. That makes sense.
NeuralProphet:

NeuralProphet’s seasonality looks very similar to Prophet’s, but the trend is definitely off and has overfit.
The explanation for this difference is easy enough.
Although the underlying implementation of the trend model is the same, NeuralProphet has no regularisation on the trend by default.
Prophet, however, puts a Laplace prior on the parameters of the trend function. (Remember that the trend was a piecewise linear function where the parameters were the delta’s at each changepoint).
The Laplace prior is the Bayesian equivalent of adding an L1 regularisation term (explanation). That means that it forces the trend delta’s to become sparse and removes changepoints from the piecewise linear function.
The NeuralProphet code conveniently allows us to add that L1 regularisation (although it will internally scale the regularisation for no clear reason)

After setting the trend_reg hyperparameter to 100, this is the plot of the components of NeuralProphet:

And this is the forecast:

Those plots are very similar to the ones from Prophet. And the average difference in sMAPE has now reduced to 0.9%.
So, NeuralProphet still performs worse than Prophet, but it has one last peg legged deus ex machina up its sleeves: AR-Net!
*Anticlimax alert* Weirdly enough, adding AR-Net doesn’t make NeuralProphet perform better than Prophet. Regardless of the AR-Net hyperparameters, Prophet still matches the performance of its neurally endowed counterpart.
This is the hypothesis:
AR-Net is trying to learn a pattern in the deviations of the sales volume from the sum of seasonality and trend. But there simply isn’t enough data to do so.
So, yes, there is enough data to learn a seasonal component and a trend. But, no, there is not enough data to learn a pattern in how the time series deviates from those components.
Unfortunately, we can’t invent new data points to prove that hypothesis on this data set, so we’ll pick a new (public) one: Iowa Liquor Retail Sales.
More DATA
The state of Iowa controls the wholesale purchases of liquor in the entire state, and they published each sales transaction since 2012. So, we know who bought what where with a daily granularity:

We’ll do a minimal amount of preprocessing. First, we remove all weekend sales. (In this discussion, the Iowa Alcoholic Beverages Division says there shouldn’t be any, so we assume it’s a mistake.) Then, we calculate the total sales volume per day in dollars for the entire state. This will be our time series:
SELECT date, SUM(sale_dollars) AS sale_dollarsFROM `bigquery-public-data.iowa_liquor_sales.sales`WHERE EXTRACT(DAYOFWEEK FROM date) NOT IN (1,7)GROUP BY dateORDER BY date
The previous dataset had 157 training data points. Since this dataset covers 8 years (without weekends) we have over 2200 data points. We can thus vary the amount of data points in the training data from 0 to 2200 and compare the performances of Prophet and NeuralProphet for each data set size.
For each data set size, the models have to forecast the sales volume 30 days ahead. The performance is again measured as the sMAPE.
This time, we can also skip the hyperparameter tuning circus. We only have to choose the input dimensions for AR-Net and set it to 30. That means that AR-Net can use the past month of sales data to look for hints about the future.
This is the result:

The plot seems to prove our hypothesis! We just needed more data for the AR-Net to learn something useful.
Conclusions
- By adding neural networks, NeuralProphet loses some of the simplicity and intuitiveness that Prophet offers. There are also more hyperparameters to tune.
- We didn’t add any external regressors. That could improve the forecasts even more.
- Conclusion of the conclusion: NeuralProphet provides better sales forecasts than Prophet if you have enough data points.
NeuralProphet outperforms Prophet if you have enough data.
No items found.